
BACKGROUND
Malnutrition
Malnutrition is a complex health condition that occurs when the body does not receive the right balance of nutrients. It can result from a deficiency, due to insufficient intake of essential vitamins, minerals, and calories, or from an excess, where there is overconsumption of calories or specific nutrients. This imbalance can lead to various health issues, including both acute (e.g., wasting) and chronic (e.g., stunting) protein-energy malnutrition, micronutrient deficiencies, and even obesity. People with severe malnutrition are also at high-risk for life-threatening infections. Malnutrition remains a major global health challenge, disproportionately affecting vulnerable populations, particularly women and children in Africa and Asia. Globally, countries have committed to ending all forms of malnutrition by 2023, including internationally agreed targets on stunting and wasting among children under five years of age (Sustainable Development Goal 2.2).¹

MALNUTRITION
Quick Facts

0 +
million people worldwide are undernourished ²
0 +
million children under 5 are affected by stunting ³

0 %
Malnutrition is the underlying cause of nearly half of the deaths in children under five. ⁴

$ 0 trillion +
is the estimated annual global cost of malnutrition ⁵
*Quick Facts references at the bottom of the page
Related CHAMPS Sites
Recent Data
Malnutrition based on postmortem anthropometry
Table 1. Percent (number) of infant and child deaths enrolled in CHAMPS that had malnutrition based on postmortem anthropometry (body measurements) as of January 7, 2026 (www.champshealth.org).
-
underweight – weight-for-age <-2 standard deviations (SD) of the WHO Child growth standards median; children with severe underweight are <-3 SD below median. stunting – height-for-age <-2 standard deviations (SD) of the WHO Child growth standards median; severe stunting is <-3 SD below median.-
wasting – weight-for-height <-2 SD of the WHO Child growth standards median; severe wasting is <-3 SD below median.
| Indicator | Total (n=2421) |
Bangladesh (n=22) |
Ethiopia (n=178) |
Kenya (n=653) |
Mali (n=168) |
Mozambique (n=323) |
Nigeria Bauchi (n=1) |
Nigeria Cross River (n=25) |
Pakistan (n=29) |
Sierra Leone (n=573) |
South Africa (n=449) |
|---|---|---|---|---|---|---|---|---|---|---|---|
| Underweight | 60.1 (1454) | 81.8 (18) | 89.3 (159) | 57.7 (377) | 60.1 (101) | 54.5 (176) | 100.0 (1) | 76.0 (19) | 82.8 (24) | 58.8 (337) | 53.9 (242) |
| Severe underweight | 45.1 (1091) | 72.7 (16) | 79.2 (141) | 42.7 (279) | 41.7 (70) | 41.5 (134) | 100.0 (1) | 68.0 (17) | 75.9 (22) | 38.0 (218) | 43.0 (193) |
| Stunting | 42.2 (1021) | 54.5 (12) | 84.8 (151) | 34.2 (223) | 35.1 (59) | 56.3 (182) | 100.0 (1) | 56.0 (14) | 75.9 (22) | 31.6 (181) | 39.2 (176) |
| Severe stunting | 28.2 (683) | 45.5 (10) | 74.7 (133) | 19.8 (129) | 23.8 (40) | 37.8 (122) | 100.0 (1) | 36.0 (9) | 62.1 (18) | 16.1 (92) | 28.7 (129) |
| Wasting | 51.9 (1256) | 54.5 (12) | 57.9 (103) | 58.0 (379) | 64.3 (108) | 38.7 (125) | 100.0 (1) | 56.0 (14) | 62.1 (18) | 56.0 (321) | 39.0 (175) |
| Severe wasting | 36.3 (879) | 40.9 (9) | 42.1 (75) | 39.1 (255) | 47.6 (80) | 27.6 (89) | 100.0 (1) | 52.0 (13) | 37.9 (11) | 38.0 (218) | 28.5 (128) |
| Any malnutrition | 73.3 (1775) | 86.4 (19) | 94.9 (169) | 70.4 (460) | 75.6 (127) | 75.2 (243) | 100.0 (1) | 88.0 (22) | 93.1 (27) | 68.4 (392) | 70.2 (315) |
| Any severe malnutrition | 55.8 (1351) | 81.8 (18) | 88.8 (158) | 50.4 (329) | 57.1 (96) | 56.3 (182) | 100.0 (1) | 80.0 (20) | 79.3 (23) | 46.4 (266) | 57.5 (258) |
Risk ratio in under 5 deaths
Figure 1. Malnutrition-related deaths had higher odds of any infectious disease in the causal chain (aOR: 2.4, 95% CI 1.7 to 3.6) compared with deaths not attributed to malnutrition. Compared with deaths from non-infectious causes, the odds of having malnutrition were higher specifically for deaths from lower respiratory infections (aOR: 4.3, 95% CI 2.9 to 6.3), sepsis (aOR: 4.2, 95% CI 2.8 to 6.2), diarrheal diseases (aOR: 3.6, 95% CI 2.0 to 6.2) and malaria (aOR: 2.0, 95% CI 1.2 to 3.1).
Green bars and dots show the relationship for unadjusted data; blue bars and dots are adjusted for age group, sex, site and location of death (community vs healthcare facility).
Reference
Madewell, Z. J., Keita, A. M., Mehta-Gupta Das, P., Mehta, A., Akelo, V., Oluoch, O. B., Omore, R., Onyango, D., Sagam, C. K., Cain, C. J., Chukwuegbo, C., Kaluma, E., Luke, R., Ogbuanu, I. U., Bassat, Q., Kincardett, M., Mandomando, I., Rakislova, N., Varo, R., Xerinda, E. G., Dangor, Z., du Toit, J., Lala, S. G., Madhi, S. A., Mahtab, S., Breines, M. R., Degefa, K., Heluf, H., Madrid, L., Scott, J. A. G., Sow, S. O., Tapia, M. D., Arifeen, S. E., Gurley, E. S., Hossain, M. Z., Islam, K. M., Rahman, A., Mutevedzi, P. C., Whitney, C. G., Blau, D. M., Suchdev, P. S., & Kotloff, K. L. (2024). Contribution of malnutrition to infant and child deaths in Sub-Saharan Africa and South Asia. BMJ Global Health, 9, e017262. https://doi.org/10.1136/bmjgh-2023-017262
Figure 2. Rates of deaths from neural tube defects are much higher in Ethiopia, a country that does not routinely add folate to any foods, compared to other CHAMPS sites. Countries with adequate folate supplementation programs should have rates of neural tube defects <5 /10,000 live births (dashed line).
Reference
Madrid, L., Vyas, K. J., Kancherla, V., Leulseged, H., Suchdev, P. S., Bassat, Q., Sow, S. O., El Arifeen, S., Madhi, S. A., Onyango, D., Ogbuanu, I., Scott, J. A. G., Blau, D., Mandomando, I., Keita, A. M., Gurley, E. S., Mahtab, S., Akelo, V., Sannoh, S., … Sorour, G. (2023). Neural tube defects as a cause of death among stillbirths, infants, and children younger than 5 years in sub-Saharan Africa and Southeast Asia: An analysis of the CHAMPS network. The Lancet Global Health, 11(7), e1041–e1052. https://doi.org/10.1016/S2214-109X(23)00191-2
Case Examples
An infant with severe malnutrition who died at home with a respiratory infection led to the diagnosis of pneumonia and a previously unknown HIV infection
An infant with severe malnutrition who died at home with a respiratory infection led to the diagnosis of pneumonia and a previously unknown HIV infection
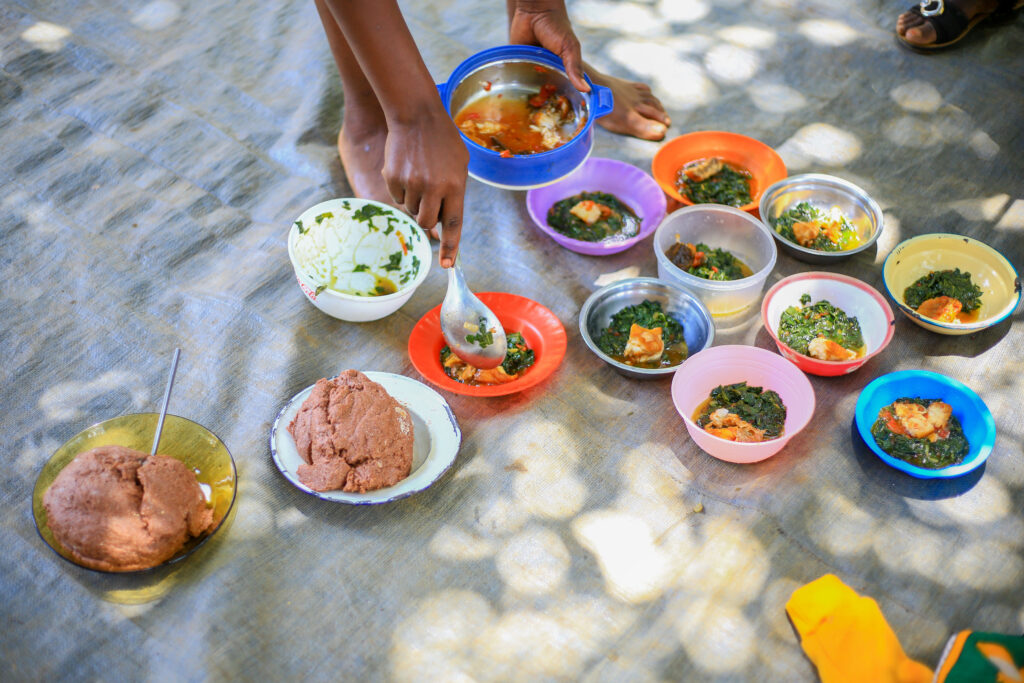
A 6 month old baby girl died at home after a week of fever, trouble breathing and cold extremities. She had not been growing well for over three months. When she died, she weighed less than when she was born.
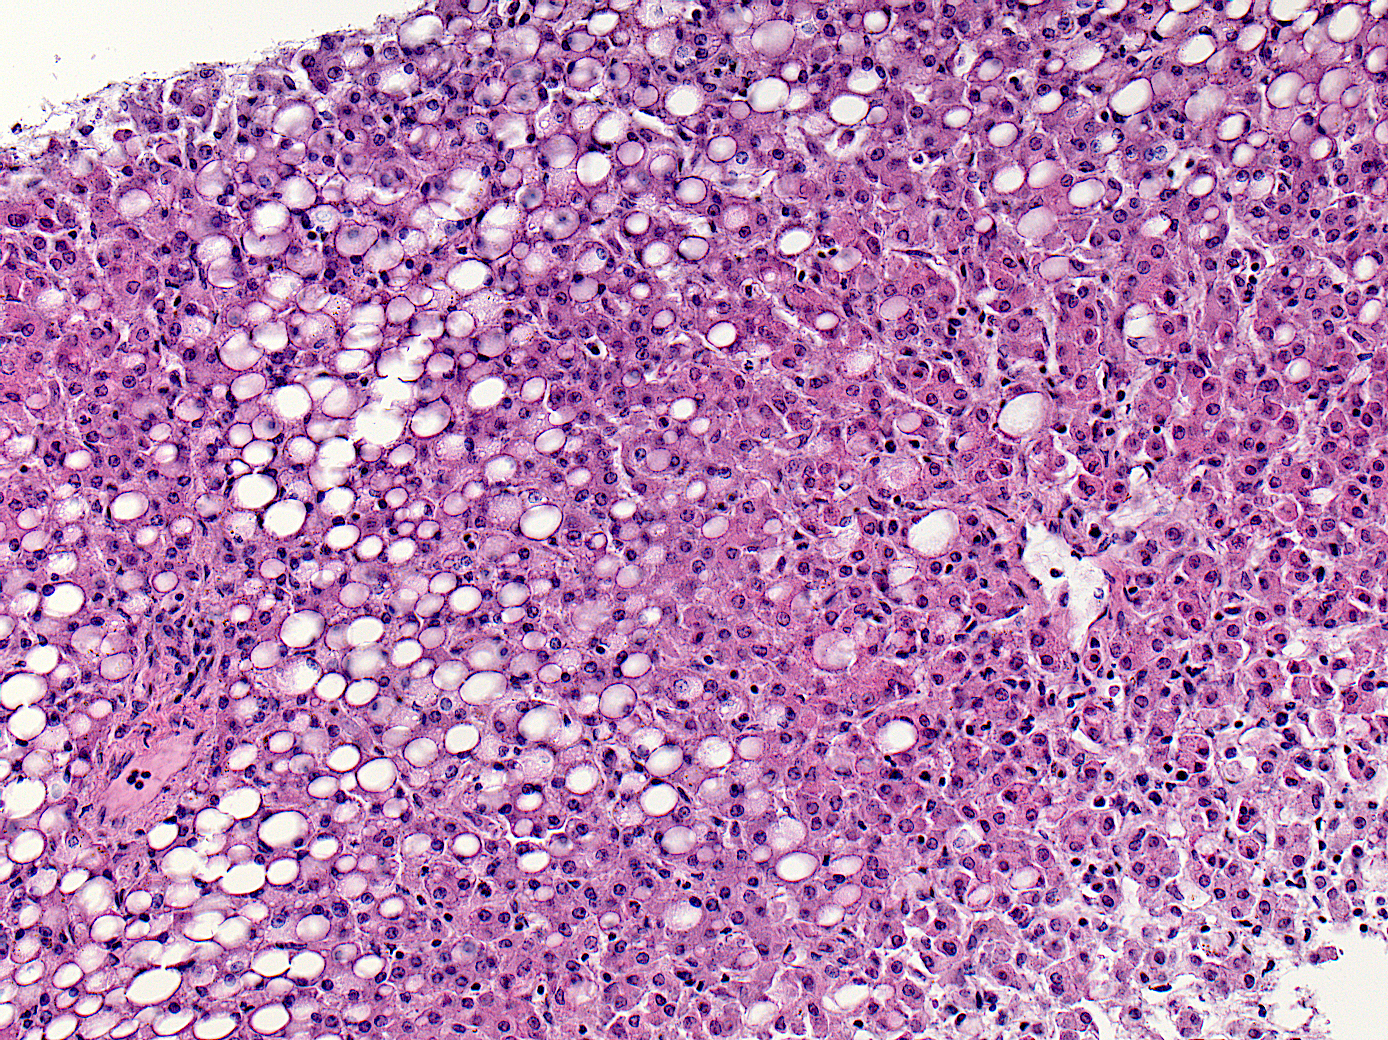
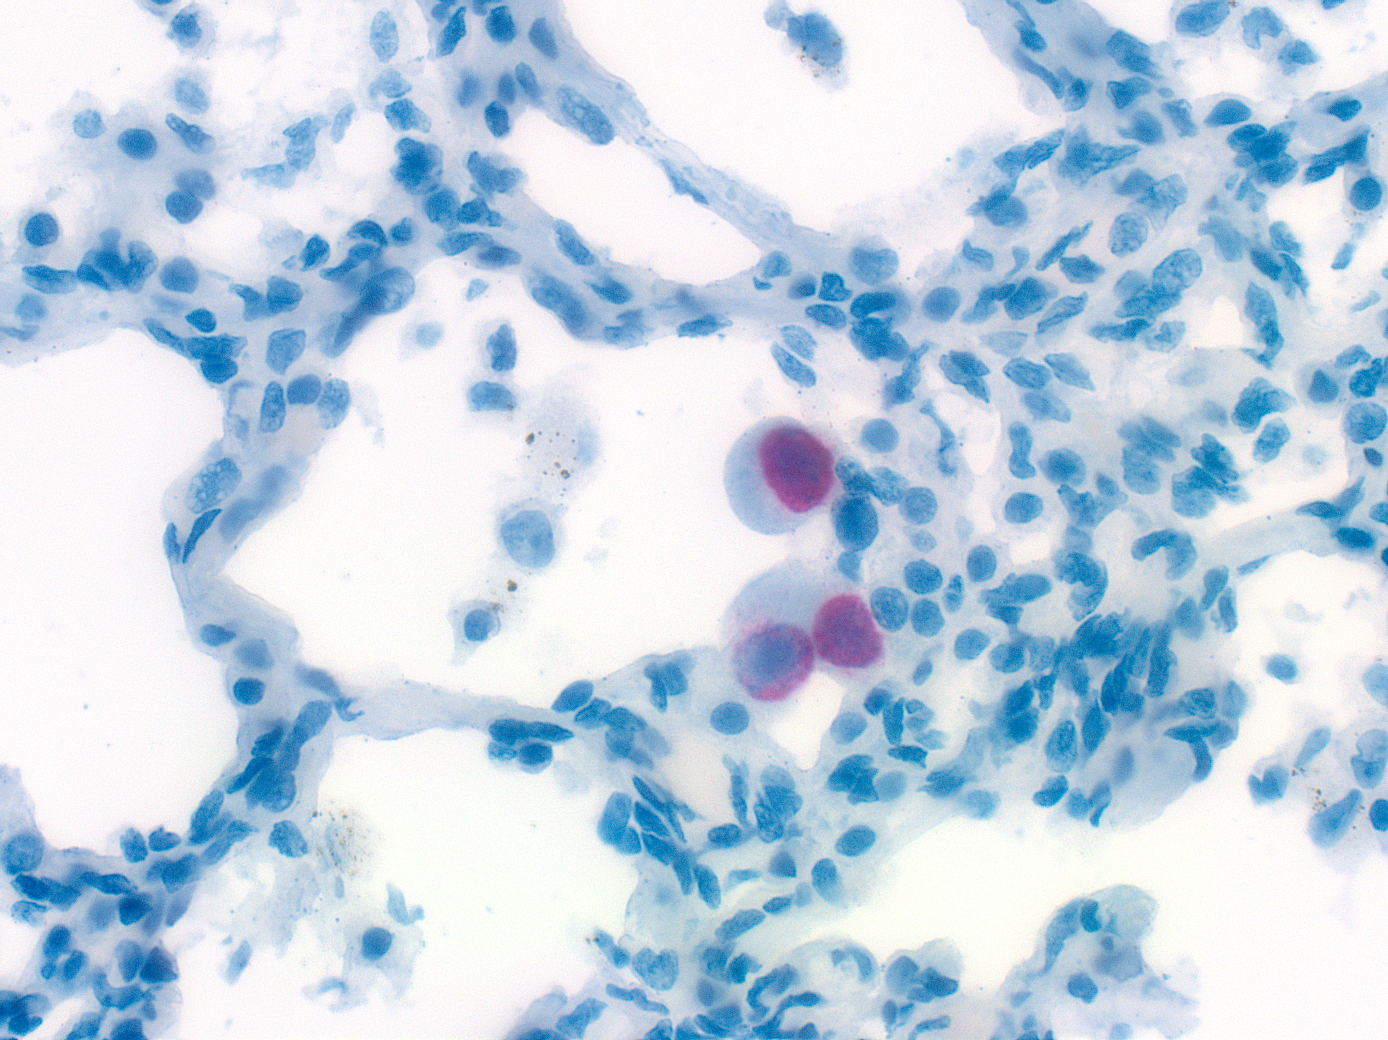
Pathology Images
Uncovering the cause
After her death the baby’s blood tested positive for human immunodeficiency virus (HIV). Her mother had been tested for HIV five months prior to the baby’s birth and was negative. She did not have testing again later during pregnancy when she must have acquired the infection. She was not on any medications that could have prevented her from passing HIV to her daughter.
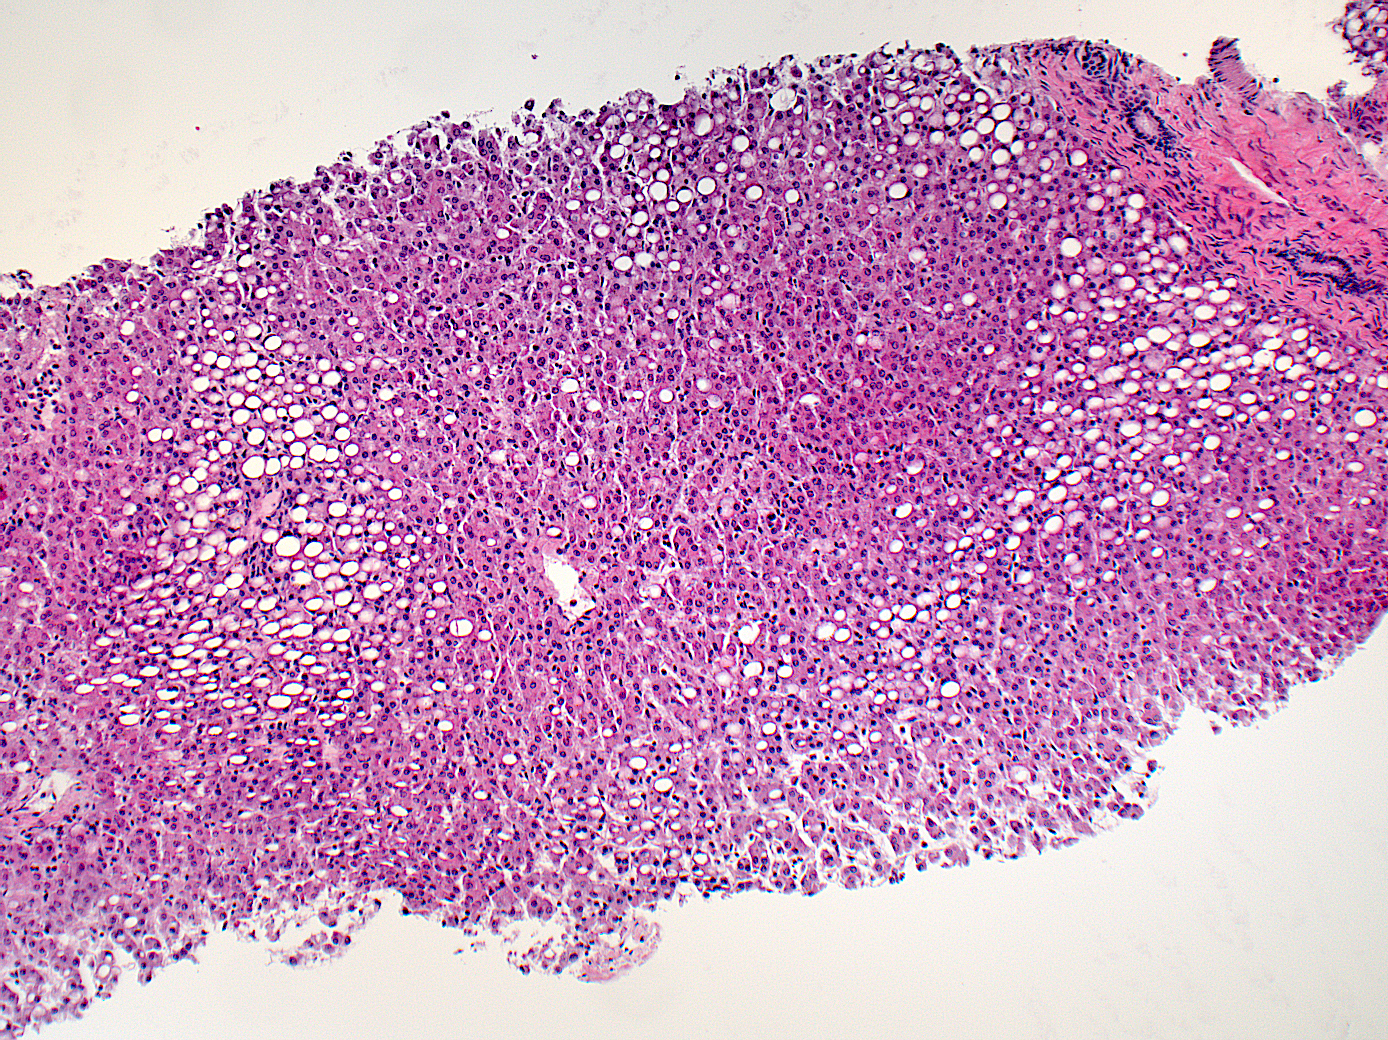
By measuring the baby’s weight after death, CHAMPS confirmed that she was severely malnourished, even though her parents reported in an interview with family members (called a verbal autopsy) that the baby was growing well. In addition, pathology examination showed that her liver was holding onto extra fat cells, a change called steatosis, which can be a sign of malnutrition.
The HIV infection and malnutrition likely worked together to weaken the baby’s immune system and make her likely to get sick from other infections, even though she was up to date on all of her recommended shots.
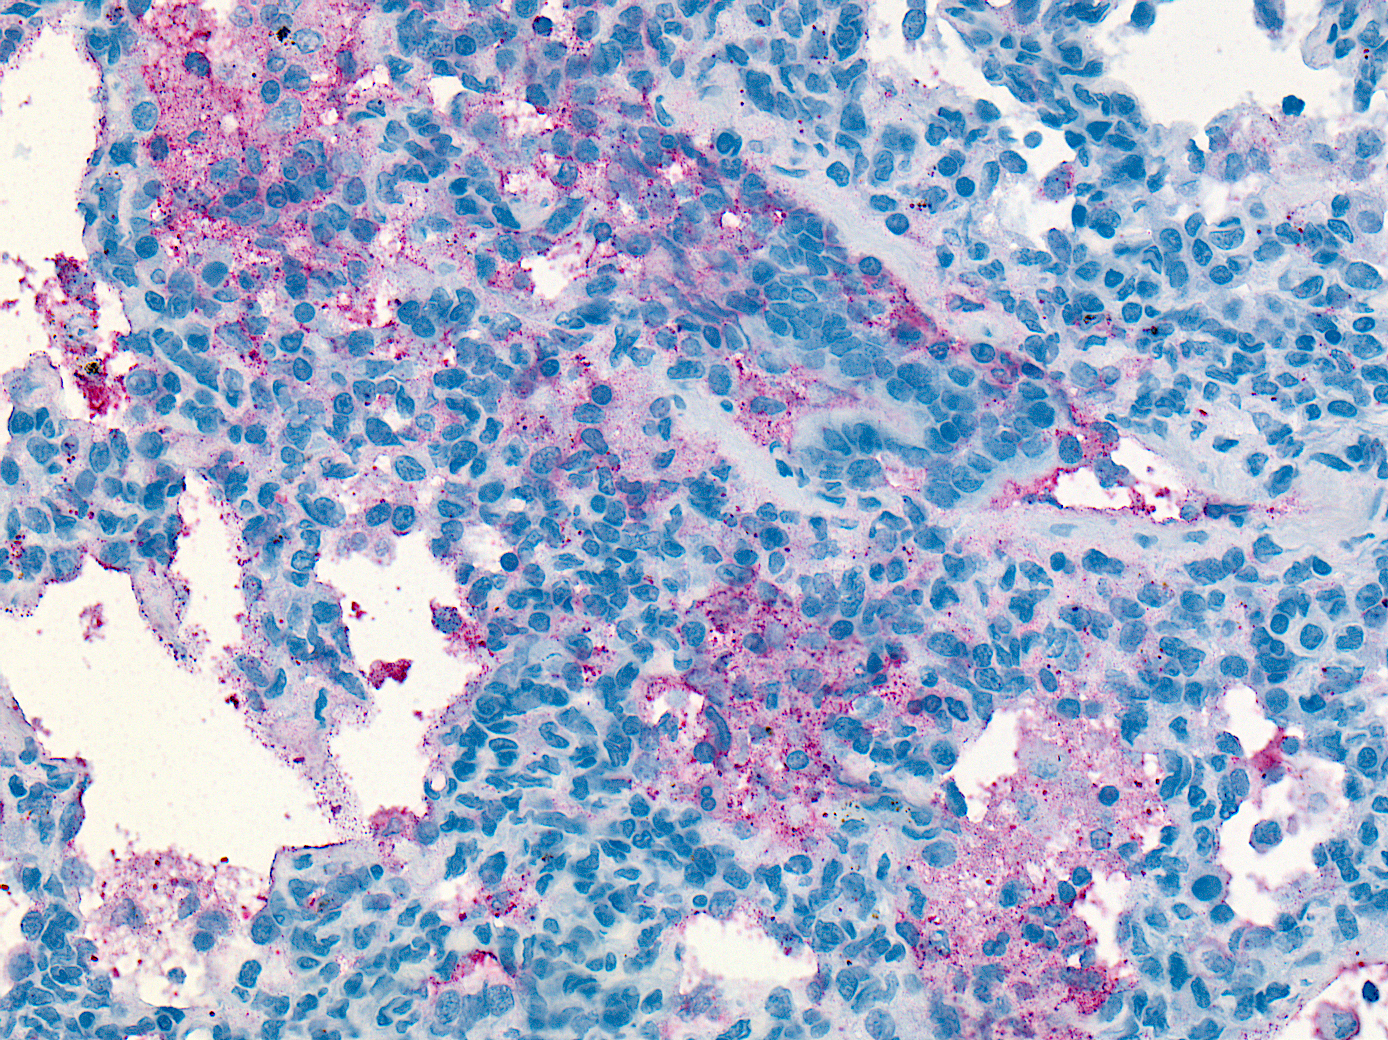
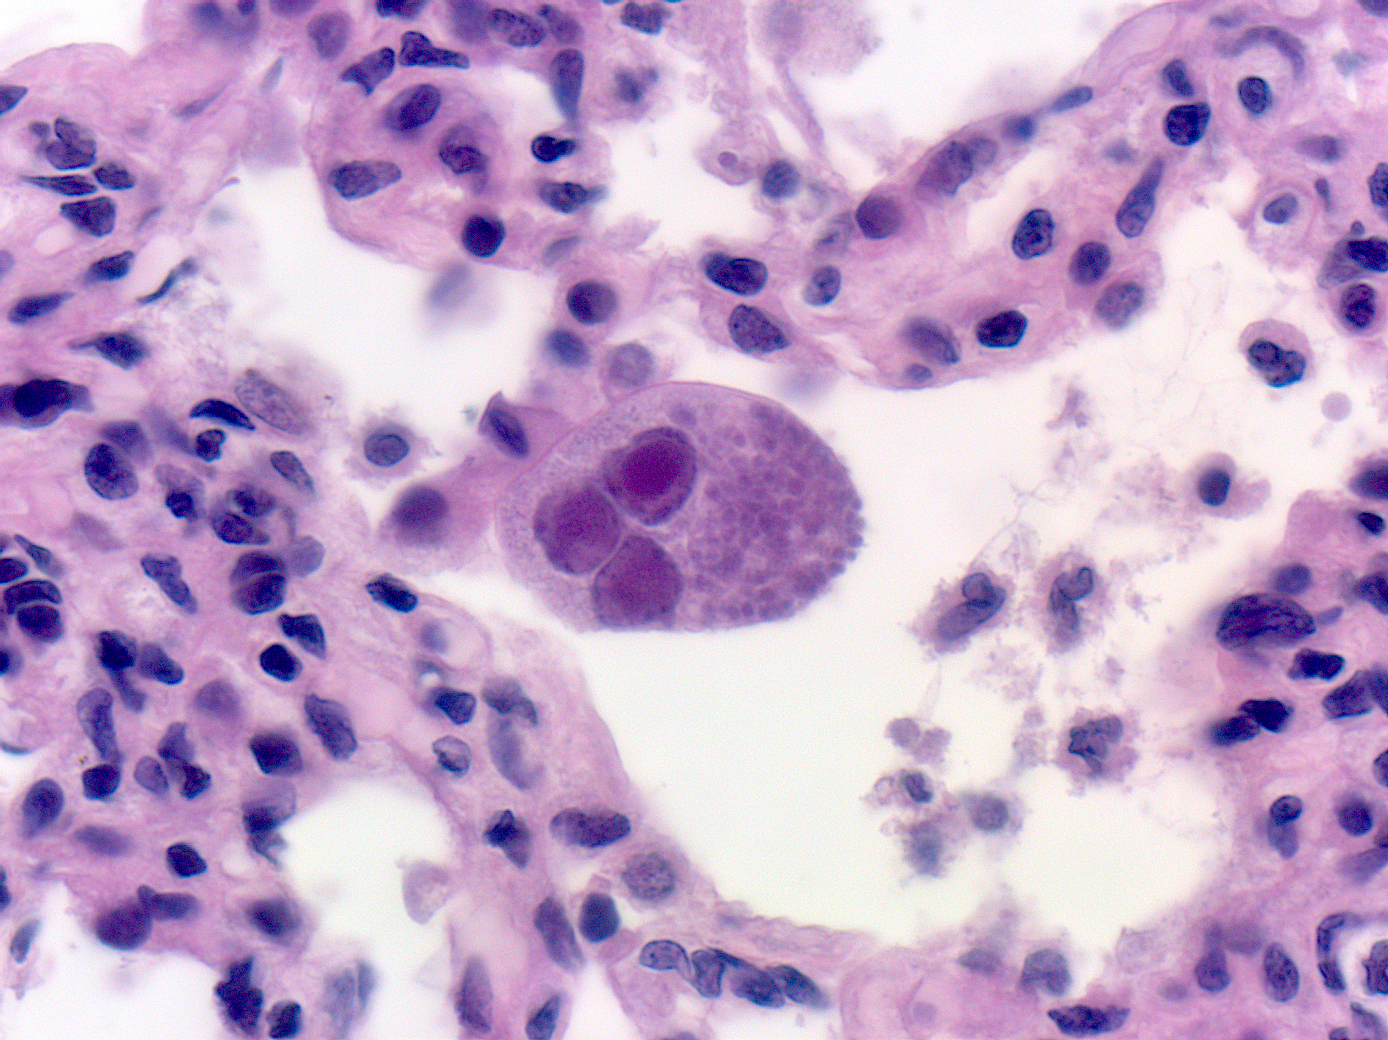
CHAMPS testing showed that the baby’s pneumonia was caused by a serious bacterial infection, Streptococcus pneumoniae, along with two viruses, cytomegalovirus and respiratory syncytial virus. Evidence of all of these pathogens were found in the baby’s lung tissue.
CHAMPS laboratory and pathology findings provided robust evidence that multiple respiratory infections led to death for this baby with underlying malnutrition and previously undiagnosed HIV.

Public Health Implications
This baby’s parents sought care several times during her life. Each of these visits to the health system was a missed opportunity for routine testing for HIV, intervention for malnutrition, or hospital care that may have led to earlier identification of her HIV- measures that could have saved her life. Local teams can work with their health care system to identify barriers to care, to strengthen capacity for identifying and treating malnourished infants and children.
Prevention of Maternal to Child Transmission (PMTCT) Programs exist to prevent mothers from passing HIV on to their babies. The World Health Organization recommends that women who live in areas with a high prevalence of HIV and who do not have the virus when they are tested early in pregnancy are retested in the third trimester, during labor, or after delivery. Studies show that women have a high risk of becoming infected with HIV during pregnancy, and a mother who acquires a new HIV infection during pregnancy has a greatly increased risk of passing the infection to her baby, yet repeat testing is not always done. This CHAMPS case emphasizes why repeat testing is important and can save lives. Local partners can ensure that all mothers receive the recommended testing and treatment for HIV to eliminate perinatal transmission of HIV.
Interested in more CHAMPS updates?
Email data@champshealth.org for information about CHAMPS pathology slide images.