

BACKGROUND
Neonatal Sepsis
The first 28 days of life represents the most vulnerable period for mortality for young children. The highest risk for mortality occurs during the early neonatal period (the first 7 days), with deaths from day 7 through day 27 categorized as late neonatal deaths. Globally, the primary causes of neonatal mortality include premature birth, birth complications (e.g., asphyxia), infections, and birth defects. While the overall mortality rate for children under five has seen a significant decline since the 1990s, the reduction in neonatal mortality has progressed more slowly compared to mortality among children aged 1-59 months.
A major, and often preventable, cause of neonatal death is neonatal sepsis. Neonatal sepsis is a severe systemic infection that contributes to over 550,000 neonatal deaths annually.1 Because neonates have immature immune systems, sepsis can progress rapidly from infection to organ failure, making early detection and intervention vital for reducing neonatal mortality globally.

NEONATAL SEPSIS
Quick Facts

0 + million Global Cases Annually
children died in the first month of life in 2024 – approximately 6,200 neonatal deaths every day.¹

0 in 5 Mortality Rate
40% of Cases are caused by bacteria resistant to standard first-line antibiotics. ² ³
*Quick facts references at the botttom of the page
Related CHAMPS Sites
Recent Data
CHAMPS Neonatal Infection Dashboard (2016–2023)
Etiologic agents causing fatal sepsis among neonatal deaths, by age, from December 2016 to December 2023.
Click main group headers to toggle shading
Click sub-headers to sort • Shift+click multi-sort
Click row to pin
| Etiologic agent |
Overall | Presumed hospital-acquired infection |
Presumed community-acquired infection |
||||||||||||
|---|---|---|---|---|---|---|---|---|---|---|---|---|---|---|---|
| Total | IMM | VEND | END | LND | Total | IMM | VEND | END | LND | Total | IMM | VEND | END | LND | |
| N=1,147 | N=188 | N=274 | N=295 | N=390 | N=537 | N=0 | N=23 | N=249 | N=265 | N=586 | N=188 | N=251 | N=44 | N=103 | |
| Gram-negative bacteria (n = 850) | |||||||||||||||
| Klebsiella pneumoniae | 478(41.7) | 58(30.9) | 112(40.9) | 142(48.1) | 166(42.6) | 260(48.4) | - | 6(26.1) | 129(51.8) | 125(47.2) | 206(35.2) | 58(30.9) | 106(42.2) | 12(27.3) | 30(29.1) |
| Acinetobacter baumannii | 295(25.7) | 8(4.3) | 51(18.6) | 105(35.6) | 131(33.6) | 244(45.4) | - | 17(73.9) | 105(42.2) | 122(46) | 48(8.2) | 8(4.3) | 34(13.5) | 0(0.0) | 6(5.8) |
| Escherichia coli | 119(10.4) | 30(16) | 32(11.7) | 17(5.8) | 40(10.3) | 35(6.5) | - | 3(13) | 14(5.6) | 18(6.8) | 81(13.8) | 30(16) | 29(11.6) | 3(6.8) | 19(18.4) |
| Pseudomonas aeruginosa | 61(5.3) | 3(1.6) | 18(6.6) | 16(5.4) | 24(6.2) | 31(5.8) | - | 0(0.0) | 15(6) | 16(6) | 26(4.4) | 3(1.6) | 18(7.2) | 1(2.2) | 4(3.9) |
| Enterobacter cloacae | 24(2.1) | 2(1.1) | 13(4.7) | 6(2) | 3(0.8) | 7(1.3) | - | 1(4.3) | 5(2) | 1(0.4) | 16(2.7) | 2(1.1) | 12(4.8) | 1(2.2) | 1(1) |
| Ureaplasma spp. | 23(2) | 4(2.1) | 13(4.7) | 2(0.7) | 4(1) | 4(0.7) | - | 0(0.0) | 2(0.8) | 2(0.8) | 19(3.2) | 4(2.1) | 13(5.2) | 0(0.0) | 2(1.9) |
| Escherichia coli/Shigella spp. | 19(1.7) | 2(1.1) | 8(2.9) | 2(0.7) | 7(1.8) | 7(1.3) | - | 0(0.0) | 2(0.8) | 5(1.9) | 12(2) | 2(1.1) | 8(3.2) | 0(0.0) | 2(1.9) |
| Pantoea spp. | 15(1.3) | 5(2.7) | 5(1.8) | 5(1.7) | 0(0.0) | 5(0.9) | - | 0(0.0) | 5(2) | 0(0.0) | 10(1.7) | 5(2.7) | 5(2) | 0(0.0) | 0(0.0) |
| Serratia marcescens | 15(1.3) | 2(1.1) | 3(1.1) | 3(1) | 7(1.8) | 10(1.9) | - | 0(0.0) | 3(1.2) | 7(2.6) | 5(0.9) | 2(1.1) | 3(1.2) | 0(0.0) | 0(0.0) |
| Haemophilus influenzae | 13(1.1) | 1(0.5) | 1(0.4) | 1(0.3) | 10(2.6) | 2(0.4) | - | 0(0.0) | 1(0.4) | 1(0.4) | 10(1.7) | 1(0.5) | 1(0.4) | 0(0.0) | 8(7.8) |
| Salmonella spp. | 13(1.1) | 0(0.0) | 5(1.8) | 4(1.4) | 4(1) | 7(1.3) | - | 0(0.0) | 4(1.6) | 3(1.1) | 6(1) | 0(0.0) | 5(2) | 0(0.0) | 1(1) |
| Treponema pallidum | 11(1) | 5(2.7) | 4(1.5) | 2(0.7) | 0(0.0) | 3(0.6) | - | 1(4.3) | 2(0.8) | 0(0.0) | 8(1.4) | 5(2.7) | 3(1.2) | 0(0.0) | 0(0.0) |
| Gram-positive bacteria (n = 251) | |||||||||||||||
| Group B Streptococcus | 65(5.7) | 32(17) | 7(2.6) | 11(3.7) | 15(3.8) | 17(3.2) | - | 1(4.3) | 9(3.6) | 7(2.6) | 46(7.8) | 32(17) | 6(2.4) | 2(4.5) | 6(5.8) |
| Staphylococcus aureus | 43(3.7) | 0(0.0) | 10(3.6) | 7(2.4) | 26(6.7) | 19(3.5) | - | 2(8.7) | 4(1.6) | 13(4.9) | 21(3.6) | 0(0.0) | 8(3.2) | 2(4.5) | 11(10.7) |
| Enterococcus faecalis | 36(3.1) | 7(3.7) | 9(3.3) | 8(2.7) | 12(3.1) | 21(3.9) | - | 1(4.3) | 8(3.2) | 12(4.5) | 15(2.6) | 7(3.7) | 8(3.2) | 0(0.0) | 0(0.0) |
| Enterococcus faecium | 34(3) | 1(0.5) | 4(1.5) | 6(2) | 23(5.9) | 26(4.8) | - | 0(0.0) | 5(2) | 21(7.9) | 8(1.4) | 1(0.5) | 4(1.6) | 1(2.2) | 2(1.9) |
| Streptococcus pneumoniae | 32(2.8) | 8(4.3) | 4(1.5) | 9(3.1) | 11(2.8) | 8(1.5) | - | 0(0.0) | 6(2.4) | 2(0.8) | 23(3.9) | 8(4.3) | 4(1.6) | 3(6.8) | 8(7.8) |
| Streptococcus spp. | 28(2.4) | 10(5.3) | 3(1.1) | 6(2) | 9(2.3) | 10(1.9) | - | 1(4.3) | 4(1.6) | 5(1.9) | 18(3.1) | 10(5.3) | 2(0.8) | 2(4.5) | 4(3.9) |
| Fungi (n = 60) | |||||||||||||||
| Candida albicans | 24(2.1) | 1(0.5) | 2(0.7) | 4(1.4) | 17(4.4) | 18(3.4) | - | 0(0.0) | 4(1.6) | 14(5.3) | 6(1) | 1(0.5) | 2(0.8) | 0(0.0) | 3(2.9) |
| Candida spp. | 10(0.9) | 2(1.1) | 0(0.0) | 1(0.3) | 7(1.8) | 7(1.3) | - | 0(0.0) | 1(0.4) | 6(2.3) | 3(0.5) | 2(1.1) | 0(0.0) | 0(0.0) | 0(0.0) |
| Virus (n = 48) | |||||||||||||||
| Cytomegalovirus | 17(1.5) | 3(1.6) | 6(2.2) | 3(1) | 5(1.3) | 8(1.5) | - | 1(4.3) | 3(1.2) | 4(1.5) | 9(1.5) | 3(1.6) | 5(2) | 0(0.0) | 1(1) |
| Respiratory syncytial virus | 10(0.9) | 0(0.0) | 0(0.0) | 0(0.0) | 10(2.6) | 5(0.9) | - | 0(0.0) | 0(0.0) | 5(1.9) | 4(0.7) | 0(0.0) | 0(0.0) | 0(0.0) | 4(3.9) |
Reference
Mahtab, S., Madhi, S. A., Baillie, V. L., Els, T., Thwala, B. N., Onyango, D., Tippet-Barr, B. A., Akelo, V., Igunza, K. A., Omore, R., El Arifeen, S., Gurley, E. S., Alam, M., Chowdhury, A. I., Rahman, A., Bassat, Q., Mandomando, I., Ajanovic, S., Sitoe, A., … Whitney, C. G. (2023). Causes of death identified in neonates enrolled through Child Health and Mortality Prevention Surveillance (CHAMPS), December 2016–December 2021. PLOS Global Public Health, 3(3), e0001612. https://doi.org/10.1371/journal.pgph.0001612
Key Findings
Group B Streptococcus is identified in stillbirths and neonatal deaths more frequently than cases where it is definitively recognized as the direct cause of death.
Group B Streptococcus is a hidden driver of stillbirths and newborn deaths. CHAMPS data reveal that Group B Streptococcus (GBS) is a significant, yet often overlooked, cause of mortality, responsible for 2.7% of all infant deaths and 2.3% of stillbirths across the studied regions. The pathogen is most lethal in the first 24 hours of life and disproportionately affects vulnerable, low-birth-weight infants. However, the burden of GBS varies drastically by location, ranging from just 0.3% of deaths in Sierra Leone to 7.2% in South Africa. This significant geographic variation suggests that policy makers should prioritize tailored, region-specific prevention strategies rather than a uniform approach, with a renewed focus on maternal interventions to prevent stillbirths. (Mahtab et.al., 2023)
Reference
Mahtab, S., Madhi, S. A., Baillie, V. L., Els, T., Thwala, B. N., Onyango, D., Tippet-Barr, B. A., Akelo, V., Igunza, K. A., Omore, R., El Arifeen, S., Gurley, E. S., Alam, M., Chowdhury, A. I., Rahman, A., Bassat, Q., Mandomando, I., Ajanovic, S., Sitoe, A., … Whitney, C. G. (2023). Causes of death identified in neonates enrolled through Child Health and Mortality Prevention Surveillance (CHAMPS), December 2016–December 2021. PLOS Global Public Health, 3(3), e0001612. https://doi.org/10.1371/journal.pgph.0001612
Antimicrobial susceptibility of Klebsiella pneumoniae isolates from deaths with K pneumoniae in the causal chain. Overall (A) and stratified by deaths occurring in the community or within 48 h of admission and those occurring more than 48 h after admission (B).
Klebsiella pneumoniae as a major cause of child deaths, accounts for about 1 in 5 (21%) of all deaths within the CHAMPS Network. It is mostly a hospital problem, causing 22% of facility deaths versus 14% in the community, usually presenting as fatal sepsis or pneumonia. A serious concern is its high level of antibiotic resistance: 84% of cases in CHAMPS are resistant to ceftriaxone and 75% resist gentamicin, raising concerns about the efficacy of current standard treatments. This highlights the urgent need for new treatment approaches, better antimicrobial stewardship, and faster vaccine development against this resistant bacteria.
Reference
Verani, J. R., Blau, D. M., Gurley, E. S., Akelo, V., Assefa, N., Baillie, V., Bassat, Q., Berhane, M., Bunn, J., Cossa, A. C. A., El Arifeen, S., Gunturu, R., Hale, M., Igunza, A., Keita, A. M., Kenneh, S., Kotloff, K. L., Kowuor, D., Mabunda, R., … Breiman, R. F. (2024). Child deaths caused by Klebsiella pneumoniae in sub-Saharan Africa and South Asia: A secondary analysis of Child Health and Mortality Prevention Surveillance (CHAMPS) data. The Lancet Microbe, 5(2), e131–e141. https://doi.org/10.1016/S2666-5247(23)00290-2
Adherence to clinical care guidelines could be improved. Suboptimal clinical care is common in cases of neonatal sepsis resulting in mortality. Recommended diagnostics and therapeutics including blood cultures and timely antibiotics, are unfortunately uncommon in neonates who died from sepsis
Reference
Rahman ARay MMadewell ZJ, et al. Adherence to Perinatal Asphyxia or Sepsis Management Guidelines in Low- and Middle-Income Countries. JAMA Netw Open. 2025;8(5):e2510790. doi:10.1001/jamanetworkopen.2025.10790
Case Examples
A neonate who died of sepsis, complicated by measles infection
A neonate who died of sepsis, complicated by measles infection
A 19-day old male who was born early (at 35 weeks’ gestation) died after being hospitalized for just over one day with fever and breathlessness.
The reasons for his prematurity are not known. There is limited documentation of prenatal care, but his mother had oligohydramnios, or lack of amniotic fluid around the baby. Her membranes ruptured (her “water broke”) five weeks-early. The baby was born via vaginal delivery, and foul-smelling fluid was noted at the time of birth, a sign of possible infection. At delivery, he did not cry right away and required resuscitation and hospital admission
Pathology Images
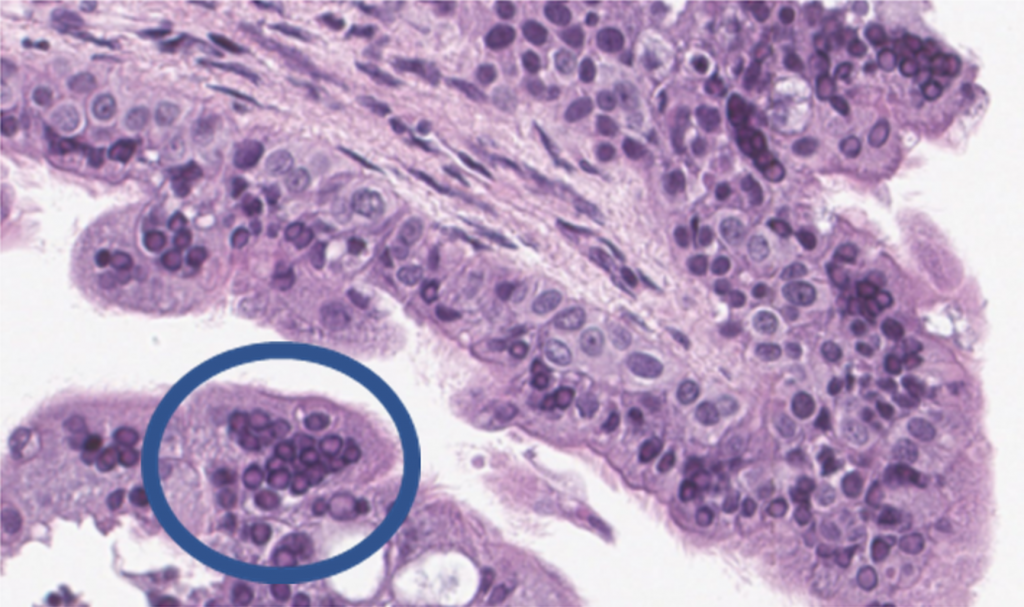
Determining the Cause
CHAMPS post-mortem blood and cerebrospinal fluid cultures were both positive for Proteus spp., a bacteria that causes infection.
Additional CHAMPS post-mortem testing unexpectedly found measles from 4 different sites throughout the baby’s tissues, blood, and cerebrospinal fluid. Pathologist examination of tissues confirmed that the baby had inflammation and viral pneumonia in the lungs with signs of measles, including syncytial giant cells and intranuclear inclusions. Pathologists tested for other viruses that cause these signs (like Respiratory Syncytial Virus, or RSV) and these tests were negative.
The CHAMPS team determined that this baby died from measles complicated by bacterial sepsis due to Proteus spp.

Public Health Implications
MMR vaccine and national coverage: Measles is a highly contagious disease particularly for babies or young children that are immunosuppressed. The World Health Organization (WHO) recommends children receive two doses of MMR (measles-mumps-rubella) vaccine, starting with the first dose at 9-12 months of age, and a subsequent (second) dose at least 4 weeks after the first injection. While neonates are too young to receive the vaccine, if there is high national coverage then herd immunity can provide some protection to the unvaccinated. However, coverage rates can unknowingly fall and individuals who already have a weakened immune system are among those most at risk for infection.
Clinical management & quality of care: WHO reports children who die within the first 28 days of birth suffer from conditions and diseases associated with lack of quality care at birth or skilled care and treatment immediately after birth and in the first days of life. CHAMPS DeCoDe panelists advise routine healthcare practices such as proper management of low birth weight during hospitalization and follow-up after discharge are critical to ensure the child is gaining weight and have no other underlying conditions.
Health-seeking behavior: It’s vitally important that mothers are educated at health facilities for signs and symptoms of illness in newborns and when to seek care. Particularly for premature babies and in this case, a fever or other danger signs are considered an emergency and should be referred to a hospital for immediate evaluation.
Implementing CHAMPS Data to Action: Sites work within their catchments on a range of health promotion areas and initiatives are informed by CHAMPS data findings and DeCoDe expert panel recommendations. The Socio-Behavioral Science Teams facilitate community education sessions for mothers to better identify signs and symptoms of illness in newborns and when to seek care. Some CHAMPS sites are in early planning stages to facilitate obstetric care refresher trainings for healthcare workers on best clinical case management practices such as proper monitoring of low birth weight, observation of other conditions that may arise, follow-up after discharge and particularly for cases when death could be preventable.
Interested in CHAMPS’s pathology slide images?
Email data@champshealth.org to learn more!