
Site News
Intern Spotlight | Adewole Odunayo Grace: Shaping the Future of Research
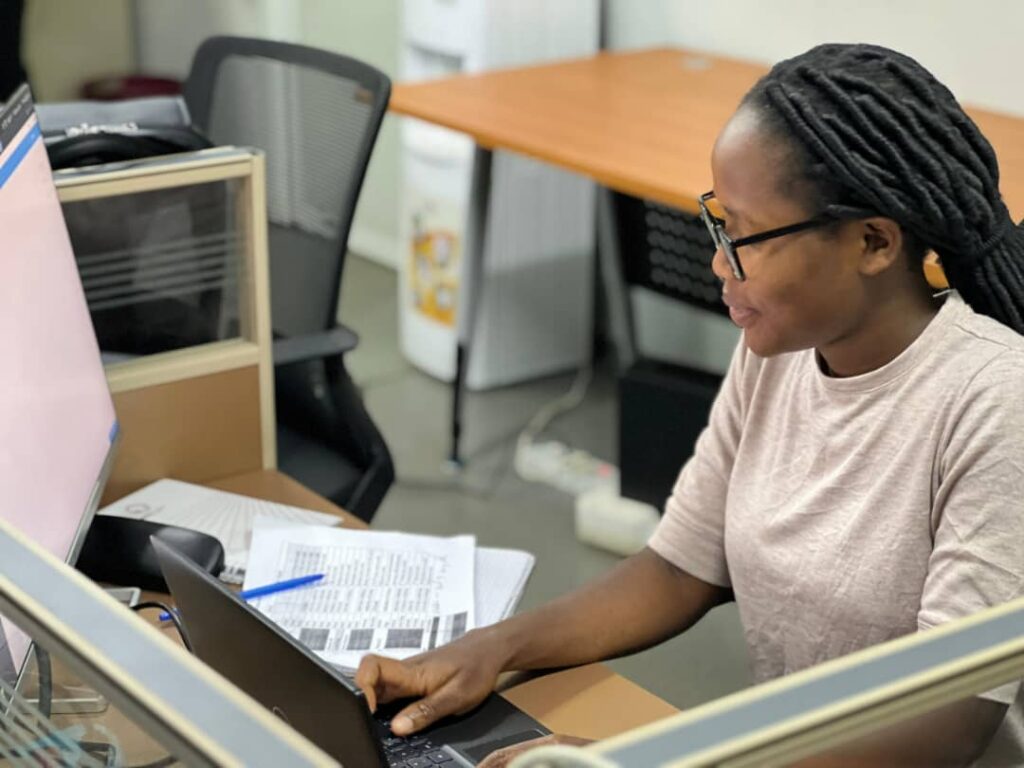
Last summer, the CHAMPS Sierra Leone team was joined by Adewole Odunayo Grace, an intern from the African Institute for Mathematical Sciences in Rwanda. Specializing in Mathematical Epidemiology, Grace spent three months (May 15 – August 31, 2025) applying her technical background to public health surveillance. Her work focused on using mathematical modeling to better understand health patterns and support data-driven decision-making within the network.
In this spotlight, Grace shares her experience transitioning from the classroom to the field and the insights she gained while working on the ground in Sierra Leone.
Part 1: The Data & The Project
1. What was the primary focus of your project?
My project focused on understanding where and when under-five mortality risk is highest in Bombali District, using CHAMPS surveillance data from 2019 to 2024. I explored how mortality patterns change over time, where high-risk clusters persist, and how factors such as environment, socioeconomic conditions, demographics, and access to healthcare shape these risks. By applying spatio-temporal analysis, I created risk maps that bring the data to life and help highlight communities that may benefit most from targeted child health interventions.
2. How did you interact with CHAMPS Data specifically?
I worked with CHAMPS surveillance data that tells the full story behind each case, including child and maternal socio-demographic characteristics and cause-of-death information generated through the DeCoDe process. I also incorporated a wealth index derived from VA/SA data to capture socioeconomic context. To understand healthcare access, I used household geolocation data in R to compute distances to the nearest health facility, enabling me to link geography with survival outcomes as I explored how these factors interact across space and time. All analyses were done in R.
3. What was the most surprising or interesting trend you found in the data?
The most surprising yet interesting trend was the temporal variation in under-five mortality, with clear peaks occurring between March and June. This pattern highlighted a period of heightened vulnerability that begins in the late dry season and extends into the early rainy season. What stood out was that increased risk was evident even during the dry season, which is often assumed to be less dangerous for child survival. Existing literature helps explain this pattern, linking the dry season to challenges such as food scarcity, dust exposure, and increased respiratory illnesses, all of which can raise the risk of mortality among young children.
4. What were the biggest challenges you faced when cleaning or analyzing this specific dataset?
One of the biggest challenges was handling missing data and incomplete denominators, which are common in real-world surveillance datasets. Missing values were addressed using multiple imputation, which allowed me to retain important information in the analysis. However, I also acknowledged its limitations: the available variables were not always sufficient to fully predict missing values, so while the imputed values were plausible, complete certainty could not be guaranteed. Another major challenge was the lack of reliable population denominators at the sub-district and enumeration-area levels, as publicly available population data are often only available at national or broad regional scales. To address this, I applied a spatio-temporal imputation approach to estimate denominators consistently across space and time.
Finally, computing distance to the nearest health facility presented practical challenges. While network-based methods using OpenStreetMap data would ideally capture real travel routes, limitations in road coverage within many West African villages made this approach unreliable. Based on existing literature, I therefore used a Euclidean distance approach, which provided a transparent and consistent proxy for healthcare access.
Part 2: The Site Experience
5. What was it like working on-site at Makeni, Bombali District?
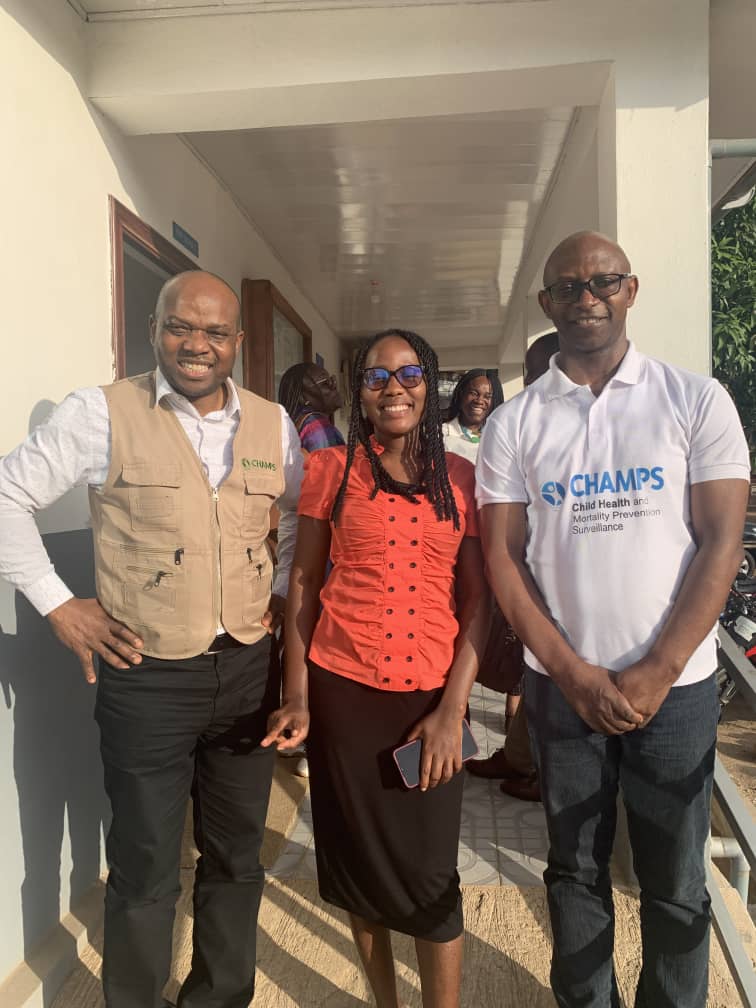
Working at Makeni, Bombali District, was an incredibly welcoming and conducive experience. From the moment I arrived, I felt expected, valued, and part of the team, thanks to the warm reception and thoughtful guidance from the Site Director, Dr. Ikechukwu Ogbuanu, and the staff.
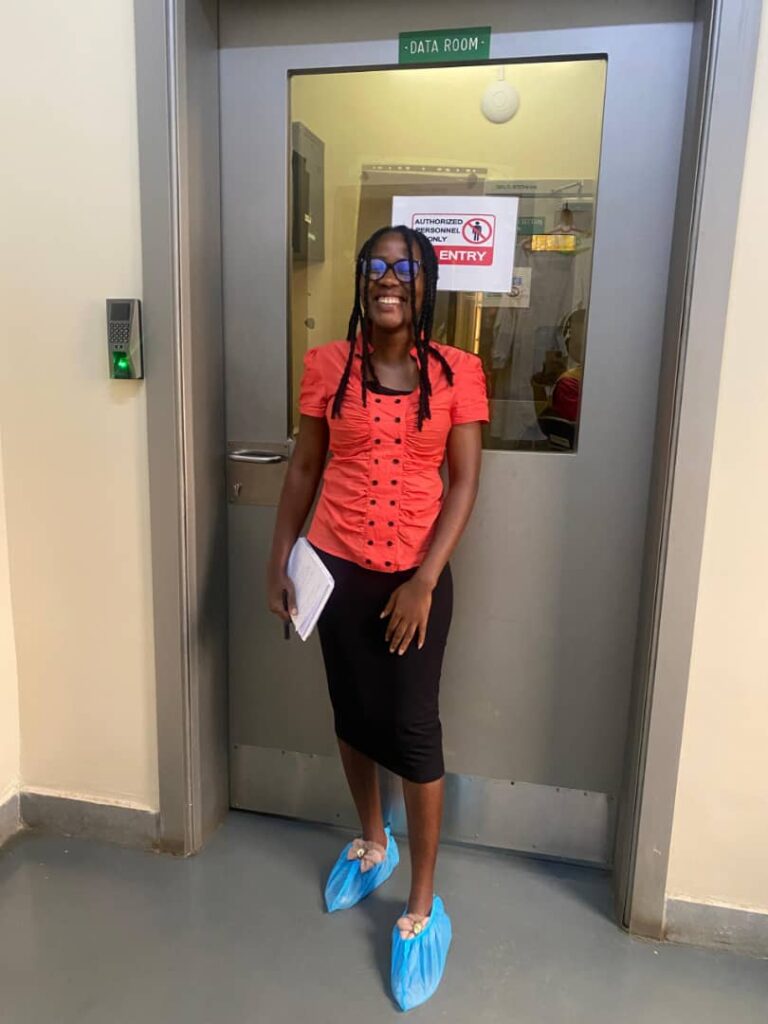
I had the opportunity to visit the lab, where I saw firsthand the microbiology tools CHAMPS uses to detect pathogens, and to engage with the local community shortly after I arrived. Witnessing how people live and how CHAMPS works to improve health and well-being in the community was eye-opening and inspiring. Being on-site, combined with the independence to work on my thesis under my supervisors’ guidance, shifted my perspective on public health research. Makeni, Bombali District, truly felt like a home, and the experience deepened my understanding of the human context behind the data I was analyzing.
6. How did being at the site change your understanding of the data you were analyzing?
Being on-site gave me a human context for the statistics I had been analyzing. Visiting the lab, the community, and its health facilities allowed me to see the real lives behind the numbers: children, families, and the conditions they live in. It made me appreciate that each data point represents a story of vulnerability, resilience, and local context. Experiencing the environment firsthand and seeing how CHAMPS works to improve child health deepened my understanding of the complex interplay between social, environmental, and healthcare factors that drive under-five mortality.
7. Who was a mentor who made a difference during your time there?
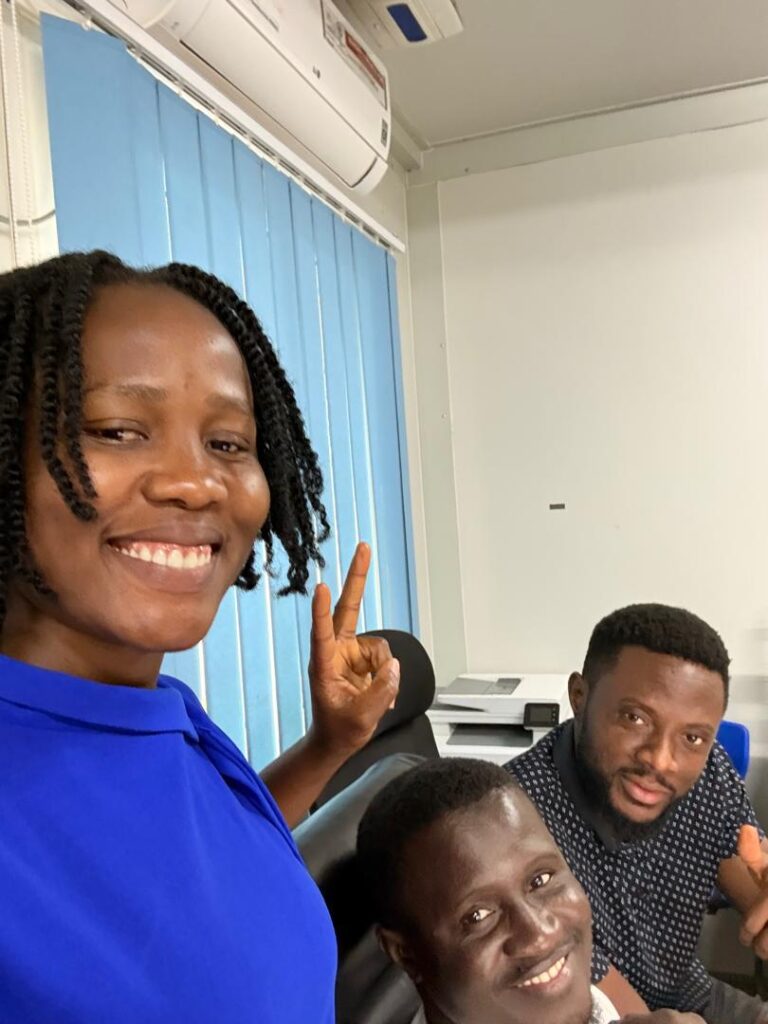
I was fortunate to have several mentors who made a lasting impact during my time at CHAMPS. Dr. Ikechukwu Ogbuanu believed in me from the start, and his encouragement meant a lot. My supervisor, Dr. Ameh Soter, demonstrated humility, discipline, and unwavering support, always available to guide me through my work. I also learned a great deal from Dickens, Able Statistician, and his data team, who patiently answered my questions and provided the resources I needed; working with them truly felt like being at home. I also appreciated the operations and logistics staff, who made daily life smooth and enjoyable, from transport to everyday interactions. From all of them, I learned valuable lessons in humility, discipline, focus, and dedication. I will always remember Mr. Balogun’s advice: “Focus on your focus so that you will be a focus one day.” Their guidance shaped both my professional growth and my perspective on teamwork.
Part 3: The Impact & Future
8. How has this internship influenced your career goals in Global Health or Data Science?
This internship set the pace for my career and showed me that I am ready for the next level, including PhD pursuing a PhD. Working independently allowed me to see my capabilities and the possibilities ahead, reinforcing my confidence in pursuing a research-focused path in Global Health and Data Science. It has inspired me to continue pushing boundaries and motivated me to make a meaningful impact in the field. I am open to a PhD opportunity in Spatial Statistics/Spatial Epidemiology. My research interests intersect between Statistics, Machine Learning, and Epidemiology/Public Health, in case there is an opportunity.
9. What advice would you give to a future intern about to start working with CHAMPS data?
I would advise future interns to clarify their research goals and methodology upfront, closely follow their supervisors’ guidance, and take the time to truly understand the CHAMPS data before jumping into analysis. Understanding the context behind the numbers is key to producing meaningful and accurate results.
Part 4: Just for Fun (Rapid Fire)
- One word to describe the CHAMPS team at your site: Humble
- Favorite local meal you ate during your internship: Salone Jollof rice and Palm Oil Soup with Rice
- Favorite tool/software shortcut you use daily: I mostly use sf in R (Simple Features for R) for spatial analysis. Beyond that, I leveraged AI tools, YouTube tutorials, online R programming resources, and even PaperPal to support my work.
- Soundtrack of your internship (one song or artist): I mostly listened to Christian music and motivational talks by Myles Munroe; my earpiece was my go-to for focus while working.